TCPWave-DDI - Forecasting Charts Using Machine Learning
Introduction
In today's dynamic era, the allocation of resources has become a primary concern in network infrastructure monitoring. So, there is a need to monitor and predict the usage of the performance metrics such as CPU, disk, and memory of various appliances within the organization to avoid network performance issues, overprovisioning, and under-provisioning. Traditional forecasting methods are challenging to detect resource usage in real-time data. Hence the organizations look forward to a solution to assess their resource usage based on the historical pattern that helps them manage their IT infrastructure in a better way. This whitepaper provides insights into TCPWave's Forecasting Charts Using Machine Learing within the IPAM application.
TCPWave's Forecasting Charts Using Machine Learning
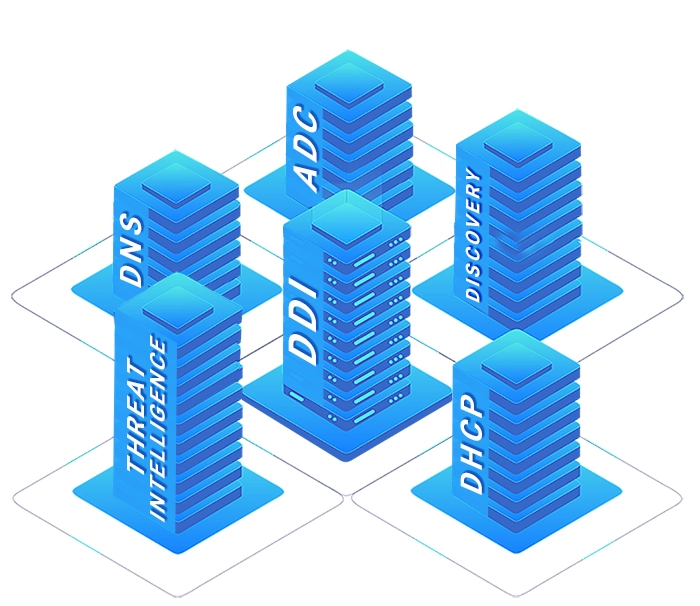
Network infrastructure monitoring with an automated forecasting system is an add-on for an organization to effectively manage network performance and business continuity. The following section explains the forecasting of IPAM, DNS, and DHCP Appliances performance metrics.
Process
Performance Metrics
Solution
IPAM Forecasting
CPU Usage Disk Usage Memory Usage</td>
SARIMA Time Series Machine Learning Model
DNS Forecasting
CPU Usage Disk Usage Memory Usage Queries Per Second (QPS)
SARIMA Time Series Machine Learning Model
DHCP Forecasting
CPU Usage Disk Usage Memory Usage Leases Per Second (LPS)
SARIMA Time Series Machine Learning Model
SARIMA Time Series Machine Learning Model
Seasonal Autoregressive Integrated Moving Average (SARIMA) is a time series Machine learning model used to forecast future data points using past data points. The model has two sets of integer parameters, denoted by (p,d,q) and (P, D, Q, S). The second set is the seasonal parameters.
Parameters
Description
p and P
The number of autoregressive terms.
d and D
Indicate differencing to make data stationary.
q and Q
Indicate moving average terms.
S
Indicate seasonal length in the data.
The historical time series data is used to forecast the performance metrics of the appliances based on daily, weekly, and monthly frequencies.
Global Policy Configuration
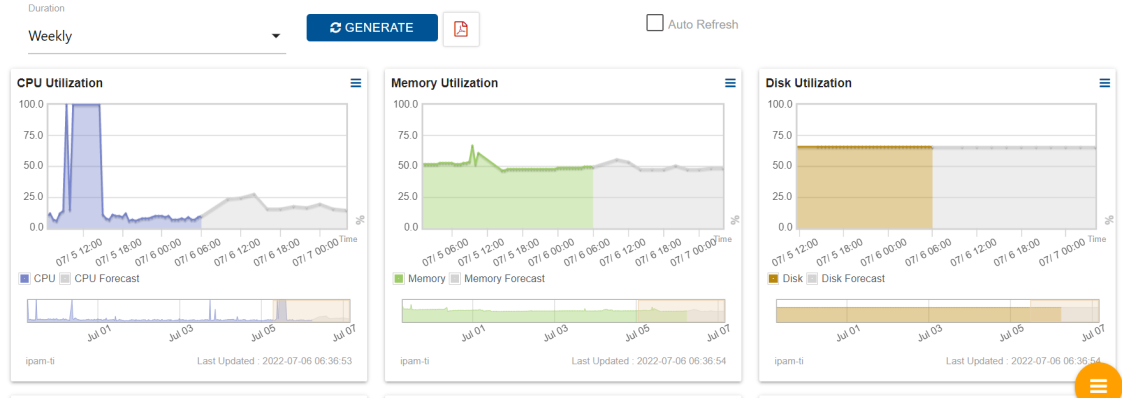
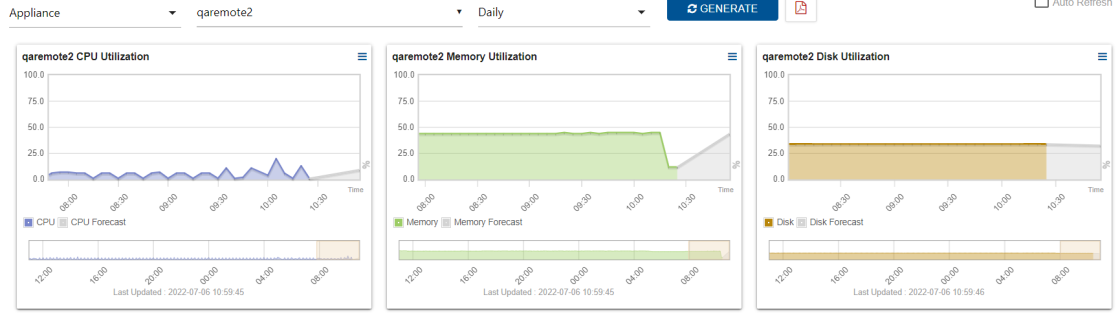
To enable the prediction of the performance metrics in the TCPWave IPAM application in the chart format under the Performance Management >> Charts section, you must set the global option Enable ML Forecasting Charts to Yes by navigating to Administration >> Configuration Management >> Global Policy Management. By default, the global option is set to No. On setting the global option to Yes, you can view the ML forecasted data in the grey shade as shown:
Navigation
Sample Screenshot
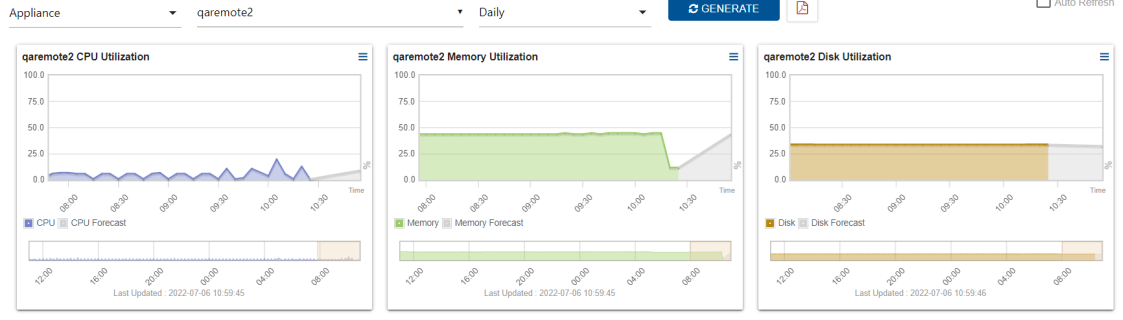
Infrastructure Management >> Performance Management >> IPAM Statistics >> Resource Utilization >> CPU Utilization, Memory Utilization, Disk Utilization
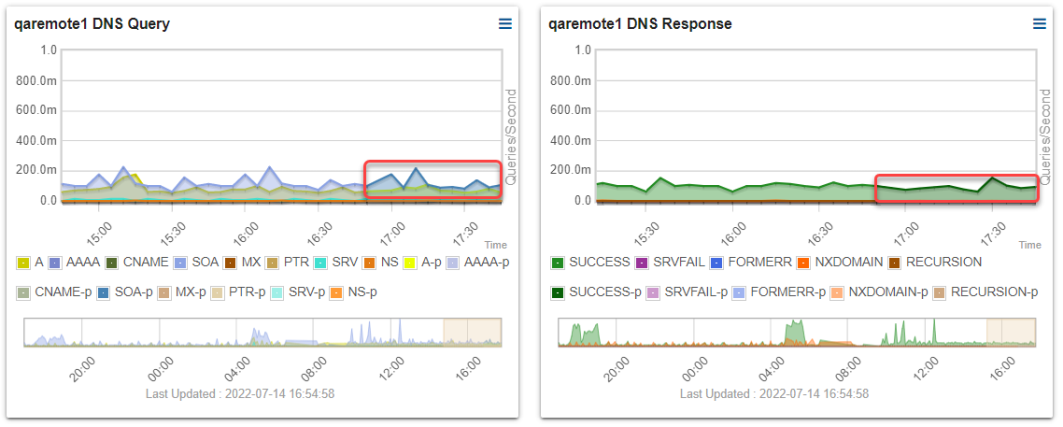
Infrastructure Management >> Performance Management >> DNS Statistics
CPU, Disk, Memory Utilizations
QPS
Note: QPS forecasted data is displayed in the highlighted part.
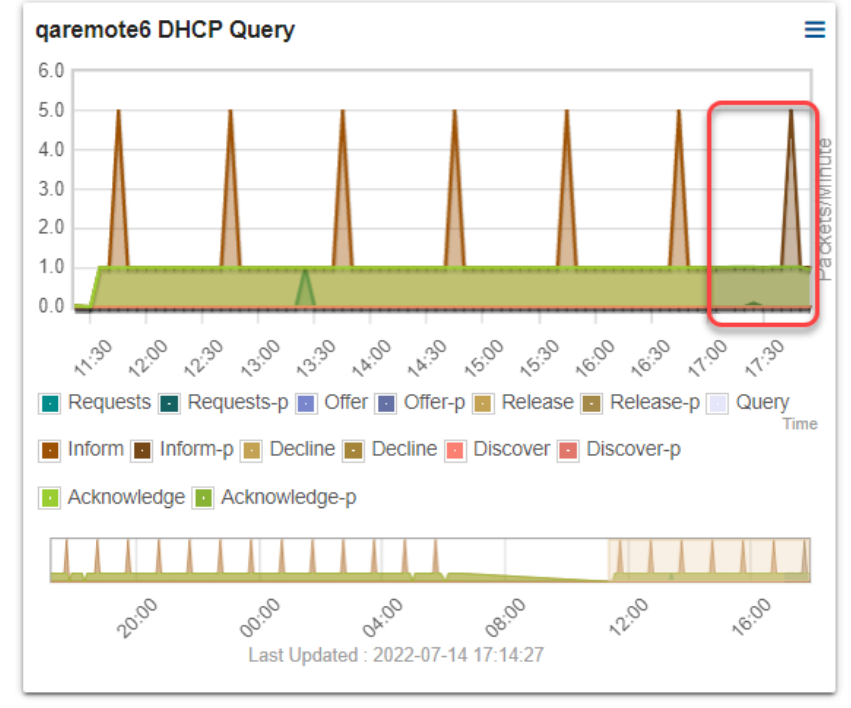
Note: LPS forecasted data is displayed in the highlighted part.
Scheduler Management
To get the instant plots, you must execute the schedule jobs for the first time after setting the global option to Yes. Otherwise, wait for the scheduled job to be executed at their scheduled time. Navigation: Administration >> Scheduler Management >> Scheduled Tasks
Name of the Schedule Job
Description
Schedule Time
CPUQPSLPSForecastDaily
Runs SARIMA ML Model for Forecasting Charts.
Daily at 23:45:00 GMT.
CPUQPSLPSForecastHourly
Runs SARIMA ML Model for Forecasting Charts.
Hourly at X:00; X = 0 to 24hrs.
CPUQPSLPSDailybestparamwriter
Writes Best Parameters for Daily data for Forecasting Charts.
Sunday at 18:00 GMT.
CPUQPSLPSHourlybestparamwriter
Writes Best Parameters for Hourly data for Forecasting Charts.
Sunday at 21:00 GMT.
Conclusion
With TCPWave's forecasting charts, one can identify the trends and patterns using historical data. Using these trends, the network administrators can detect the outliers using Median Absolute Deviation statistical model that helps separate genuine insights from seasonal variations. It ensures enhanced security and reduced risks associated with excessive resource usage, safeguarding your organization's entire IT infrastructure, and is integral for meeting compliance needs. For a quick demo, contact the TCPWave Sales Team.
We use cookies on this site to
improve your browsing experience, analyze individualized usage, and
website traffic tailor content to your preferences, and make your
interactions with our website more meaningful. By clicking "Accept All" closing this banner, or continuing to browse this site, you
consent to the use of cookies.