In today's dynamic era, organizations must build a comprehensive picture of network operations based on the data from all the components. As human data integration and analytic activities can't keep pace with the amount of information generated, many organizations outrun traditional monitoring; therefore, organizations look forward to have well-capacity planning. It allows to determine the changing network infrastructure and meet the future demands. So, when the users look at the operational stability of DNS platforms during any attack or migration, capacity planning is vital to ensure operational resilience. This white paper provides insights on TCPWave's Capacity Planning Dashboard.
Why - Capacity Planning
Capacity Planning is essential to service availability and business continuity. It is a critical ongoing process involving CPU Utilization, Disk Utilization, Memory Utilization assessment, traffic volumes, etc that helps organizations identify the cause for performance bottlenecks, when and where upgrades are needed. With proactive capacity planning measures, the organizations might face increased customer satisfaction, SLA being met and no possible outages.
TCPWave's - Capacity Planning Dashboard
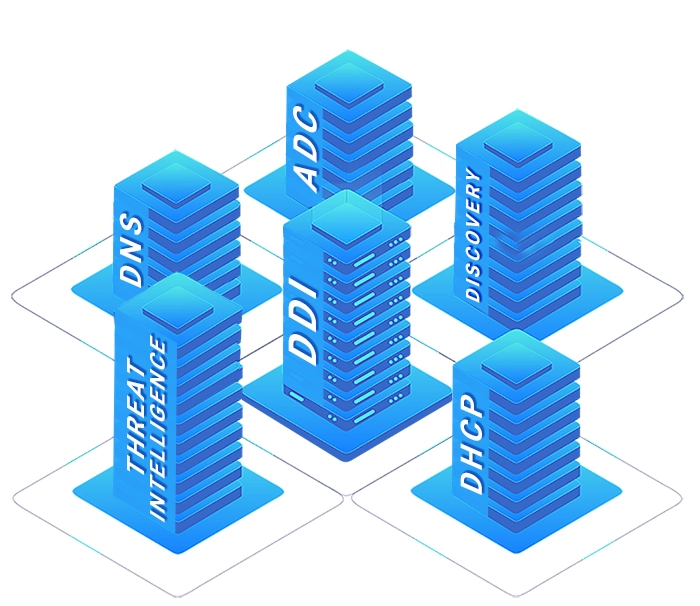
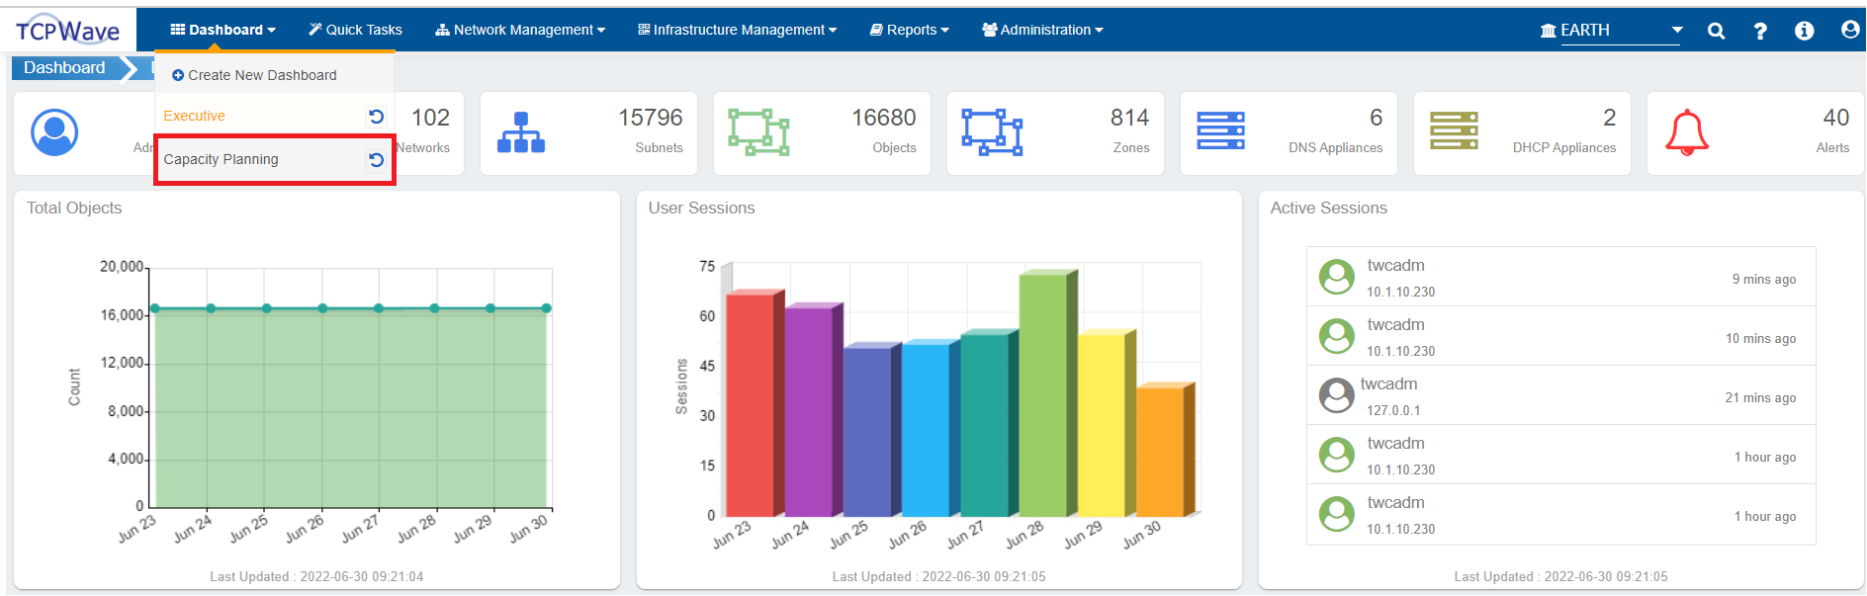
TCPWave's Capacity Planning Dashboard is handy for a capacity planner to get a quick snapshot of the top sections across the DDI infrastructure and a view of their capacity. This dashboard helps your organization analyze, monitor, and alter network capacity patterns. The core network services contain valuable data about the organization's networks and applications. The network administrators can view the data into actionable intelligence that helps to troubleshoot network and application issues, uncover security threats, and address compliance requirements. To access this dashboard, click on Dashboards >> Capacity Planning-it displays the parameters in the section-wise manner as shown. The time window for the information is one day.
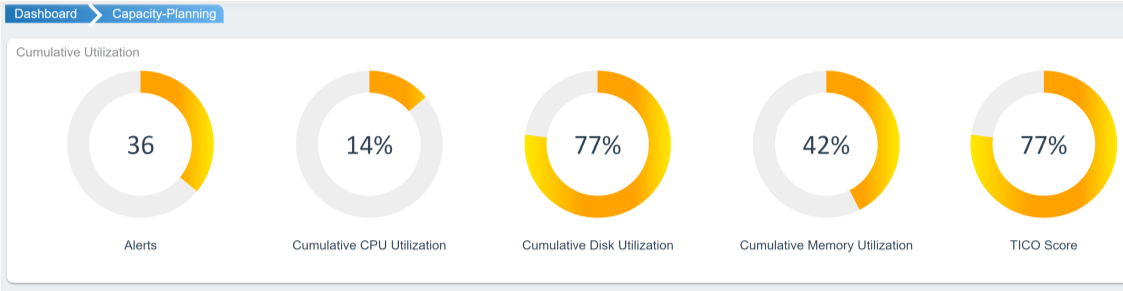
Cumulative Utilization
Description
Alerts
It displays the count of critical alerts that provides quick insight and allows faster troubleshooting of the network issues.
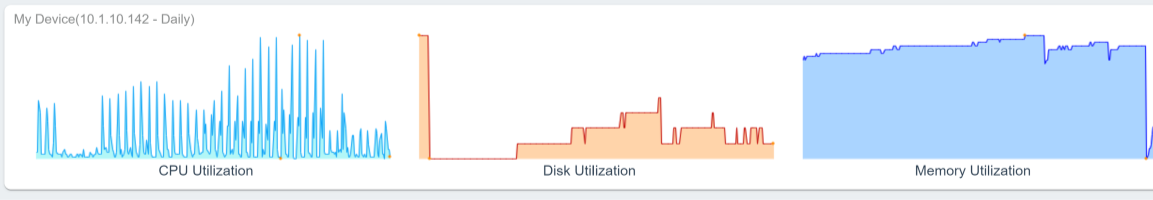
CPU Utilization Disk Utilization Memory Utilization
This widget provides utilization % of the mentioned parameters by a DNS appliance over time. It helps the network administrators to identify potential risk areas where further resources may be required and plan for future requirements by viewing the trends over time.
TICO Score
It stands for TCPWave Infrastructure Computed Overall score. It provides an overall picture of the TCPWave appliances health to a network administrator.
Sample Screenshot
Parameter Name
Description
CPU Utilization Disk Utilization Memory Utilization
This widget provides utilization % of the mentioned parameters by a IPAM appliance over time. It helps the network administrators to identify potential risk areas where further resources may be required and plan for future requirements by viewing the trends over time.
Sample Screenshot
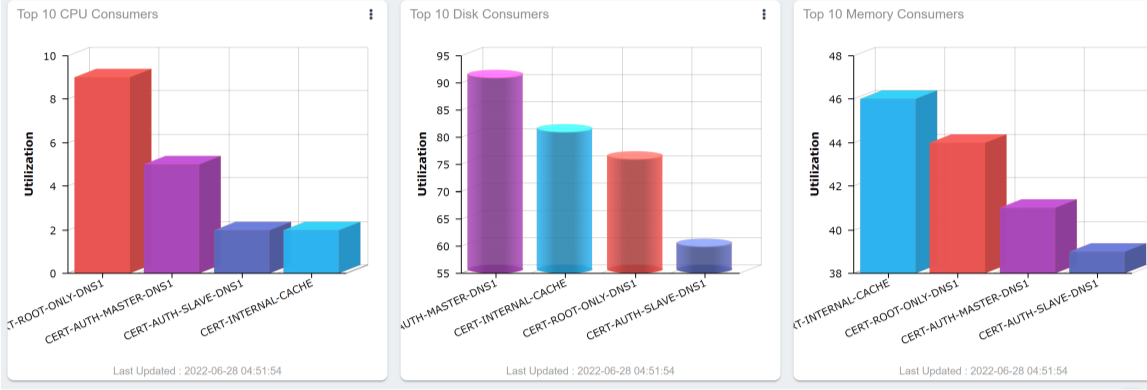
Top 10 Consumers
Description
CPU Disk Memory
This widget provides the visibility of the top ten utilization of the mentioned parameters. It displays the utilization (MB) on Y-axis of various DNS appliances on X-axis over a time.
Sample Screenshot
Parameter Name
Description
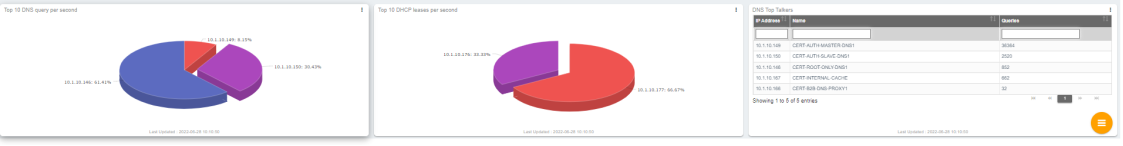
Top 10 queries per second
Mouse hover the pie slice to view the count and percentage of the traffic handled by a particular DNS appliance at a given time.
Top 10 leases per second
Mouse hover the pie slice to view the count and percentage of the requested IP address. It helps for compliance tracking or auditing.
DNS Top Talkers
Displays the count of the queries handled by various appliances for a given day.
Sample Screenshot
Conclusion
The TCPWave's customized Capacity Planning Dashboard has the breadth to capture all the network metrics to isolate the capacity impacting network events and provide visibility to facilitate the capacity planning. It has a great interface that balances visualizations and key insights well that is it provides a complete overview of the traffic flows, applications, devices and interfaces. For a quick demo, contact the TCPWave Sales Team.
We use cookies on this site to
improve your browsing experience, analyze individualized usage, and
website traffic tailor content to your preferences, and make your
interactions with our website more meaningful. By clicking "Accept All" closing this banner, or continuing to browse this site, you
consent to the use of cookies.